

Drought and Precipitation Monitoring in the Caribbean
Standardised Precipitation Index (SPI)
A number of drought/precipitation indices are currently under investigation at CIMH, with the view to them being used together to monitor drought and periods with extremely high precipitation. The Standardised Precipitation Index (SPI) is one such index under investigation
The Standardised Precipitation Index (SPI), developed by T.B. Mckee, N.J. Doesken and J. Kleist (McKee et al. 1993) of Colorado State University is an index that, if used carefully, can provide early warning of an extended drought period and aid in assessing drought severity. It can also provide similar information at the other end of the spectrum- extremely high precipitation. SPI is basically a representation of rainfall in units of standard deviation. Positive values indicate greater than median rainfall; negative values indicate less than median rainfall. The severity classes are shown in Table 1.
Table 1
SPI Values and precipitation intensities (Mckee et al 1993)
|
SPI |
Category |
Probability (%) |
|
2.0 + |
Extremely wet |
2.3 |
|
1.5 to 1.99 |
Very wet |
4.4 |
|
1.0 to 1.49 |
Moderately wet |
9.2 |
|
-0.99 to 0.99 |
Near normal |
68.2 |
|
-1.0 to -1.49 |
Moderately dry |
9.2 |
|
-1.5 to -1.99 |
Severely dry |
4.4 |
|
-2.0 and less |
Extremely dry |
2.3 |
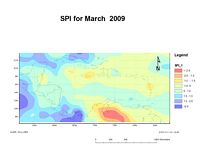
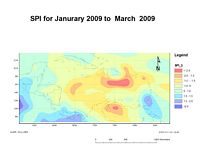
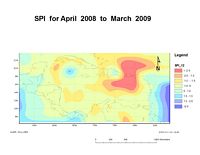
The SPI is flexible and can be calculated for different time scales. A time scale analysis reflects the impact of drought on the availability of the different water resources. A one-month SPI analysis reflects short term soil moisture and crop stress especially during the growing season. A three-month SPI analysis reflects short to medium term moisture and can give an indication of available moisture conditions at the beginning of the growing season. A six-month SPI analysis reflects medium term trends in rainfall and is effective in showing rainfall distribution over distinct seasons as well as being associated with anomalous stream flows and reservoir levels, which takes longer to manifest itself than does agricultural drought. A twelve-month SPI can indicate potential periods of shortfall in groundwater amounts.
Using NCEP/NCAR reanalysis data in combination with data from land based stations, SPIs are calculated in 1, 3, 6 and 12 month time intervals for the Caribbean basin as part of the Caribbean Drought and Precipitation monitoring Network . CIMH hopes to add more land stations in due course.
When used in combination with forecast products, such as seasonal precipitation forecasts (http://www.cimh.edu.bb/curprecip.htm), projections can be made on the future
status of drought (or extreme high rainfall) for the region. CIMH is currently investigating the use of other indices to monitor drought and precipitation.
For further information contact Mr. Adrian Trotman at atrotman@cimh.edu.bb or Mr. Anthony Moore at amoore@cimh.edu.bb.
| a) | b) | c) | d) |
 |
 |
 |
 |